
What is the demand for natural ingredients for cosmetics on the European market?
Europe is one of the largest and fastest-growing markets for cosmetics in the world. Demand for natural ingredients is increasing. This makes Europe an interesting market for companies seeking to enter the market, such as those selling new and innovative natural ingredients. Western European countries have large consumer markets and important trading hubs. They offer the most opportunities for exporters of all kinds of natural ingredients, specifically vegetable and essential oils.
Contents of this page
- Sector description: cosmetics
- What makes Europe an interesting market for natural cosmetic ingredients?
- Which European markets offer the most opportunities for natural ingredients for cosmetics?
- Which products from developing countries have the most potential in the European natural ingredients for cosmetics market?
1. Sector description: cosmetics
The European cosmetics market is one of the most active regions in the global beauty and personal care industry. According to the Europe Cosmetics Market Size, Share | Industry Report 2030, the European cosmetics sector will continue to grow through the end of the decade. This growth comes from higher consumer awareness of skin care, personal grooming and wellness-oriented beauty routines. Demand also grows because companies offer more products and online retail is expanding. People across Europe have more money to spend as well.
The global cosmetic industry is also growing steadily. The market size of cosmetic ingredients will increase at a compound annual growth rate (CAGR) of 4.6% until 2025, amounting to roughly $33.8 billion by 2025. The global cosmetics industry has six major categories: fragrances, hair care, makeup, oral care, skincare and toiletries. The global skincare market size was worth USD 115.65 billion in 2024. It will grow from USD 122.11 billion in 2025 to USD 194.05 billion by 2032. This equals a growth rate of 6.84% per year.
ISO 16128-1:2016 gives guidance on how to define natural and organic cosmetic ingredients. The standard also describes other ingredient types that companies may need when they develop natural or organic products. It explains the limits that apply to these ingredients as well.
According to the standard, natural ingredients come from plants, animals, micro-organisms, or minerals. Companies can obtain them using physical processes, fermentation, or solvent extraction, as long as there is no chemical modification. Ingredients from fossil fuels are not seen as natural.
These natural materials are often complex. This often makes them harder to test for safety. They contain many different parts. Their composition may change because of farming or harvesting methods, seasonal conditions, plant species and location. This causes large differences between materials, which can make it difficult to assess them in a reliable way.
Table 1: Description of ingredients for cosmetics by category
| Category | Definition | Examples | Purpose / Benefits |
|---|---|---|---|
| Functional Ingredients | Essential ingredients required for product structure, stability, or manufacturing | Emulsifiers, thickeners, preservatives | Help products function as intended (for example, mixing oil and water) |
| Performance Ingredients | Provide specific cosmetic benefits to skin or hair | Humectants, occlusives, emollients, anti-ageing agents, UV filters | Moisturising, anti-ageing, UV protection |
| Natural Ingredients | Derived from plants, minerals, or animals | Lignins (hazelnut/walnut shells), grape byproduct extracts | Eco-friendly and perceived safer; may offer bioactivity |
| Synthetic Ingredients | Chemically produced in laboratories | Panthenol, silicones, synthetic preservatives | Stable, consistent, cost-effective, fast-acting |
Source: Based on the article Sharma et al., 2023.
The classification shown here is an important tool to understand how supply chain logistics, regulations and product information are connected. However, it is important to note that HS codes have limits when used for international trade in natural ingredients. The codes listed here only provide general guidance for product classification.
Table 2: Description of natural ingredients for cosmetics by category
| Product Category | HS Codes (Cosmetics Relevant, HS2022) | Description / Examples | References |
|---|---|---|---|
| Vegetable oils & fats | 1508, 1509, 1512, 1513, 1515 | Cold-pressed oils (jojoba, argan, almond), seed oils | ISO 16128-1:2016; Access2Markets |
| Essential oils | 3301 | Steam-distilled aromatic extracts (lavender, tea tree) | IFRA Standards (2023); ITC Trade Map |
| Plant extracts (botanicals) | 3301.90, 3304.99 | Solvent or CO₂ extracts of herbs, roots, leaves | EU CosIng; ISO 9235 |
| Floral waters / Hydrosols | 3301.90 | Distillation by-products (rose water, neroli water) | Access2Markets; Cosmetic Europe |
| Plant butters | 1515.90 | Shea butter, cocoa butter, mango butter | COSMOS; FAO Oils & Fats Manual |
| Natural waxes | 1521, 1515.90 | Beeswax, carnauba wax, rice bran wax | EU Cosmetic Regulation 1223/2009 |
| Natural colorants | 3203, 3204 | Anthocyanin, turmeric, beetroot extract | EU Reg. 1223/2009 Annex IV |
| Natural antioxidants | 2936, 2938 | Tocopherol, ascorbyl palmitate | CosIng, SCCS |
| Natural surfactants | 3402 | Saponins, alkyl polyglucosides (APG) | COSMOS v4.0 |
| Resins & gums | 1301 | Gum arabic, xanthan gum, resin extracts | ITC Trade Map |
Source: ITC Trade Map, COSMOS, CosIng, IFRA Standards, Access2Markets, 2025
An important point is that HS Code 1211 covers MAPs (Medicinal and Aromatic Plants). These include plants that people mainly use for perfumery, pharmacy, or for insecticidal, fungicidal, or similar purposes. They can be raw plants and plant parts (fresh, chilled, frozen, or dried; whole, cut, crushed, or powdered), as well as seeds and fruits. However, this code does not include all raw aromatic plant materials that belong to MAPs, such as spices and flavourings. It also does not include processed forms like essential oils and extracts. These products fall under separate HS codes.
According to Zamani et al (2025), HS Code 1211 has 7 main subgroups. The groups include the following items:
- 121110: Licorice roots, fresh, chilled, frozen, or dried, whether or not cut, crushed, or powdered.
- 121120: Ginseng roots, fresh, chilled, frozen, or dried, whether or not cut, crushed, or powdered.
- 121130: Coca leaf, fresh, chilled, frozen, or dried, whether or not cut, crushed, or powdered.
- 121140: Poppy straw, fresh, chilled, frozen, or dried, whether or not cut, crushed, or powdered.
- 121150: Ephedra plants and parts, including seeds and fruits, fresh, chilled, frozen, or dried, cut, crushed, or powdered.
- 121160: Bark of African cherry ‘Prunus africana’, fresh, chilled, frozen or dried, whether cut, crushed, or powdered.
- 121190: Plants, including seeds and fruits, used primarily in perfumery, in pharmacy, or for insecticidal, fungicidal or similar ginseng roots, coca leaf, poppy straw, ephedra and African cherry.
These codes play an important role in international trade. They clearly classify medicinal and aromatic plant products. Suppliers need to understand these codes because they help them find the right markets and countries. When suppliers use the correct HS codes, they can meet export rules, follow demand trends and send their products to the right global markets.
Suppliers must also consider other important factors. Products can become contaminated at various stages of the supply chain, so companies must do hazard analysis to protect consumers. Both natural and synthetic ingredients need checks for chemical, physical and microbiological risks, as well as for natural allergens, before companies contact potential European buyers.
An extra challenge is the absence of a standardised naming system for herbal ingredients. Some companies use botanical terminology, while others rely on pharmaceutical or common names. This inconsistency makes it harder to confirm plant identity and to control safety.
Tips
- Use the correct HS code for your product, and clearly show it. HS directories can give useful information on import and export requirements, help you find markets, and support smoother international trade.
- Add traceability data to your pitch. European buyers expect proof of origin, not just claims.
- Focus on low-environmental-impact processing methods (cold-pressing, green extraction, solvent-free options).
- Provide access to technical documentation early (CoA, SDS, allergen list, contaminants report). This helps buyers review your product faster.
- Show any certifications in progress (COSMOS raw material approval, organic farming, FairWild, Fairtrade), and be ready to share traceability documents with buyers.
2. What makes Europe an interesting market for natural cosmetic ingredients?
According to the newest research, skincare products are the largest part of the cosmetic industry in Europe. In 2019, they made up more than 27% of the cosmetic market. In 2021, Germany used the most cosmetic products, valued at approximately €13,600 million. This was followed by France and Italy at approximately €12,000 million and €10,600 million, respectively.
The Italian cosmetic industry recorded an increase in the global turnover of 10 percentage points in 2021, rising from €10,700 million to €11,800 million. This trend was positively affected by exports, which grew by 13.8% and reached a value of over €4800 million compared to the previous year.
Figure 1: Market Share by Product Category 2025
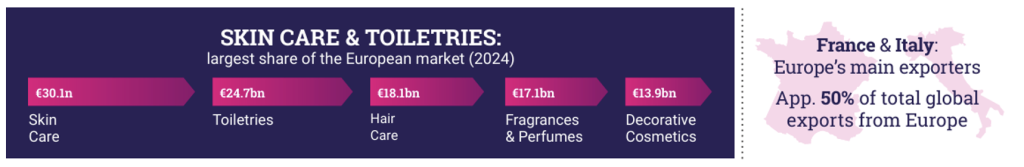
Source: Cosmeticseurope.eu, 2025
Share of natural and organic cosmetics within total cosmetics consumption
According to Precedence Market Research, the global natural and organic cosmetics market size will reach about $103.23 billion by 2034. It will grow from $41.65 billion in 2024. This means that the market will grow at a CAGR of 9.50% each year from 2025 to 2034. In 2024, the North America natural and organic cosmetics market reached $19.16 billion. The market is growing because buyers know more about natural and organic products. They want products that are safe, eco-friendly and sustainable.
Source: Precedence research, July, 2025
According to research by Precedence, consumers are more aware of the benefits of natural and organic cosmetic products. This is clear from the increase in the number of natural and organic cosmetics offered through major retailing channels. Consumers are also more sensitive to natural and organic products. Because of this, there is an increase in the overall demand for natural and ecologically clean materials in cosmetic production. It creates new possibilities for exporters of natural cosmetic ingredients, even if a cosmetic product that contains the exporter’s ingredient is not certified as natural or organic.
Over time, consumers have become more sensitive to the effects of personal care products on the environment. This includes the impact of packaging used and the raw materials used in production. Some of these materials can cause environmental damage. As a result, consumers are turning to natural cosmetics proteins that are environmentally friendly and come from sustainable sources.
An international trade analysis shows a clear upward trend in imports and exports between 2020 and 2024. Global imports (Figure 3) increased by approximately 37% during this period. This shows a strong recovery and growth in trade. The European Union holds a leading position, with about 36% of total global imports. Within the EU, Germany is the largest importer, followed by France and the United Kingdom. Ireland showed the strongest growth, recording a 75% increase in imports over four years.
European imports from developing countries also increased between 2020 and 2024. These countries now play a larger role in supplying natural and nature-driven cosmetic ingredients. Data from the ITC Trade Map platform show that many botanical extracts, essential oils and other natural raw materials come from developing and emerging economies. These include countries in Latin America, Africa and Asia-Pacific.
The same data show strong growth in higher-value natural ingredients from these regions. This shows the rising EU demand for traceable and sustainably sourced inputs. These inputs support natural and organic product positioning. Germany, France and Ireland are not only large consumer markets; they also act as processing and redistribution hubs. They import raw or semi-processed natural ingredients from developing countries to make finished cosmetic products for the EU and export markets.
Source: ITC Trade Platform, 2025.
Turning to exports (Figure 4), the analysis shows a strong trend. Global exports rose by 38% from 2020 to 2024. The European Union leads global exports. It accounts for about 56% of the world’s total exports. Within the EU, France emerges as the EU’s top exporter, followed by Germany and Ireland. Spain shows the strongest growth. Its exports increased by 108% since 2020. Overall, the EU keeps a large trade surplus, reflecting its strong competitive position and export-oriented economy.
Both imports and exports show steady recovery after 2020. Germany, France and the United Kingdom lead imports. France, Germany and Ireland lead exports. The fastest-growing import markets are Ireland, Austria and the Netherlands. The fastest-growing export markets are Spain, Denmark and Ireland. These countries show strong trade growth during this period.
Source: ITC Trade Platform, 2025.
Import and export trends of natural ingredients by cosmetic category
According to ITC Chapter 33, ‘Essential oils and resinoids; perfumery, cosmetic or toilet preparations’, this category includes essential oils, resins and other perfumed substances. It also includes mixtures used in perfumes, cosmetics and personal care products. The chapter covers many products. These include perfumes, toilet waters, make-up products, skincare creams, hair care products, oral hygiene items, and other cosmetic or toiletry preparations that are not listed elsewhere.
Table 3: HS headings 3301 to 3307 from the International Trade Centre (ITC)
| HS code | Description |
|---|---|
| HS 3301 | Essential oils (terpeneless or not), including concretes and absolutes; resinoids; extracted oleoresins; concentrates of essential oils in fats, in fixed oils, in waxes or the like, obtained by enfleurage or maceration; terpenic by-products of the deterpenation of essential oils; aqueous distillates and aqueous solutions of essential oils. |
| HS 3302 | Mixtures of odoriferous substances and mixtures (including alcoholic solutions) with a basis of one or more of these substances, of a kind used as raw materials in industry; other preparations based on odoriferous substances, of a kind used for the manufacture of beverages. |
| HS 3303 | Perfumes and toilet waters. |
| HS 3304 | Beauty or make-up preparations and preparations for the care of the skin (other than medicaments), including sunscreen or suntan preparations; manicure or pedicure preparations. |
| HS 3305 | Preparations for use on the hair. |
| HS 3306 | Preparations for oral or dental hygiene, including denture fixative pastes and powders; yarn used to clean between the teeth (dental floss), in individual retail packages. |
| HS 3307 | Pre-shave, shaving or after-shave preparations, personal deodorants, bath preparations, depilatories and other perfumery, cosmetic or toilet preparations, not elsewhere specified or included; prepared room deodorisers, whether or not perfumed or having disinfectant properties. |
Source: ITC Trade Center, 2025.
Based on ITC data by category, the data shows a strong and growing global trade in cosmetics, perfumery and personal care products. The European Union is the main regional leader. It is both a large production hub and a major consumer market. Some categories show stable and mature growth, others show more change. This reflects changing consumer demands and new competition in the market.
HS 3301: Essential Oils and Raw Materials
This code covers raw materials and base ingredients for the fragrance and flavour industry. The global market is large and grew steadily from 2020 to 2024. The EU is a net importer in this category. Its imports are higher than its exports by about $300,000-500,000 over the years. This shows that the EU produces many of these materials, but it uses them even more. Much of this demand comes from its large perfumery and cosmetics industry.
Table 4: Major exporters and importers of Essential oils and Raw Materials
| Major exporters | The world market is relatively fragmented, but France and Germany are the EU's leading exporters. |
|---|---|
| Major importers | Germany and France are also the largest importers within the EU, reinforcing their role as central hubs for fragrance and flavour manufacturing and consumption. |
| Notable trend | Ireland shows a significant and growing import value into the EU, potentially linked to its pharmaceutical and chemical industries which may use these materials. |
Source: ProFound, 2025
Source: ITC Trade Platform, 2025
Source: ITC Trade Platform, 2025
HS 3302: Odoriferous Mixtures for Industry
This category includes concentrated fragrance bases sold to manufacturers, for example, for beverages, perfumes and cleaning products. This is a high-value and specialised market. One clear pattern stands out. Ireland is a strong outlier in exports, accounting for over a third of all EU exports. The EU as a whole is a large net exporter. Ireland drives most of this export growth.
Table 5: Major exporters and importers of Odoriferous Mixtures for Industry
| Major exporters | Ireland dominates, followed by France and Germany. |
|---|---|
| Major importers | France is the largest importer within the EU. |
| Notable trend | The EU runs a very large trade surplus in this category. |
Source: ProFound, 2025
The market includes high-value products. Large companies in a few countries shape it, particularly in Ireland.
Source: ITC Trade Platform, 2025
Source: ITC Trade Platform, 2025
HS 3303: Perfumes & Toilet Waters
This category forms the core of the luxury goods sector within Chapter 33. The market is large and has experienced very strong growth from 2020 to 2024. The EU is a powerful net exporter in this category. France is the clear leader. Its export value is more than double that of Spain, the next largest EU exporter. France alone accounts for a large share total EU exports.
France’s leading position in HS 3303 is supported by the presence of globally dominant fragrance and luxury groups. These include LVMH (with brands such as Parfums Christian Dior, Guerlain, Givenchy), CHANEL, L’Oréal Luxe and Interparfum. France also has many fragrance manufacturers and license holders. Besides this, France hosts world-leading fragrance creators and compounders such as Givaudan, dsm-firmenich, IFF and Robertet. Their production, formulation and export activities strongly support France’s position as the EU’s main exporter of perfumes and toilet waters.
Table 6: Major exporters and importers of Perfumes and Toilet Waters
| Major exporters | France is the clear global and EU leader by a wide margin. Spain and Italy are also major players. Spain shows especially strong growth, with a sharp increase in 2024. |
|---|---|
| Major importers | Germany is the largest importer within the EU, acting as a major distribution and consumer market. The Netherlands and the UK are also significant importers. |
| Notable trend | Germany's exports fell sharply in 2024. This may be due to corporate restructuring or changes in supply chain. |
Source: ProFound, 2025
This is a high-growth, high-value market dominated by France's luxury brands.
Source: ITC Trade Platform, 2025
Source: ITC Trade Platform, 2025
HS 3304: Beauty and Make-up Preparations
This is the largest product category by trade value. It forms the core of the colour cosmetics and skincare market. The EU is a strong net exporter, but the gap between exports and imports is narrower than in perfumery.
Table 7: Major exporters and importers of Beauty and Make-up Preparations
| Major exporters | France is again the leader, followed by Germany and Italy. Poland has become a significant and growing exporter. This may point to a shift in manufacturing toward Central Europe. |
|---|---|
| Major importers | The United Kingdom has seen a consistent decline in its exports in this category, while its imports have grown. |
| Notable trend: | The EU holds a strong position and production is becoming more diverse. |
Source: ProFound, 2025
Source: ITC Trade Platform, 2025
Source: ITC Trade Platform, 2025
HS 3305: Hair Preparations
This category shows steady growth each year. The EU is a clear net exporter, indicating a strong and competitive hair care industry. The market is more balanced among large players than in perfumery.
Table 8: Major exporters and importers of Hair Preparations
| Major exporters | Italy, Germany and France are the top three exporters. By 2024, Italy takes a slight lead. |
|---|---|
| Major importers | Germany is the largest importer, followed by the UK and France. This shows that even the main producing countries trade many different products within the single market. |
| Notable trend: | The EU's trade surplus is stable and significant. |
Source: ProFound, 2025
Source: ITC Trade Platform, 2025
Source: ITC Trade Platform, 2025
HS 3306: Oral and Dental Hygiene
This market includes products like toothpaste and dental floss. It is stable but shows the slowest growth of all categories. This is typical for everyday essential products. The EU is a net importer in this category, which is unique among the codes reviewed. This shows that a large portion of the EU's consumption is met by production outside the EU.
Table 9: Major exporters and importers of Oral and Dental Hygiene
| Major exporters | Germany and Poland are the leading exporters within the EU. |
|---|---|
| Major importers | Germany is also the largest importer, followed by the UK and France. |
| Notable trend: | Poland has shown strong and steady growth in both exports and imports. It has become an important regional hub for this category. |
Source: ProFound, 2025
Source: ITC Trade Platform, 2025
Source: ITC Trade Platform, 2025
HS 3307: Other Toilet Preparations
This category includes deodorants, bath products and shaving products. It is a large market with steady growth. The EU is a solid net exporter, showing its strength across many personal care products.
Table 10: Major exporters and importers of other toilet preparations
| Major exporters | The United Kingdom is the leading exporter, followed closely by Germany and France. This shows the UK's strong position in this segment, despite wider geopolitical changes. |
|---|---|
| Major importers | Germany is again the largest importer. The UK and France are also important markets. |
| Notable trend: | Poland and the Netherlands are strong and growing exporters, showing that the production in the EU is becoming more diverse. |
Source: ProFound, 2025
In conclusion, the European Union is a global leader in medium- to high-value cosmetics and perfumery products (HS 3302, 3303, 3304, 3305, 3307). Its strength comes from luxury branding, especially in France, strong industrial capacity in Germany and Italy, and specialised corporate hubs in Ireland.
On the other hand, the EU acts more as a large consumption market for everyday mass-market goods (HS 3306) and raw materials (HS 3301). This leads to a trade deficit or a more balanced trade position. The data also shows the growing role of Central and Eastern European countries. Poland, in particular, is becoming an important manufacturing and export centre across several categories.
Source: ITC Trade Platform, 2025
Source: ITC Trade Platform, 2025
Important consumer and sustainability drivers of natural ingredients in cosmetics demand
Demand for natural ingredients in cosmetics is mainly driven by health, environmental and ethical concerns. These concerns are supported by growing interest in sustainability and transparency. Brands that clearly address these issues and explain their actions are better able to meet changing consumer expectations.
Health, environmental and ethical concerns are the main drivers of natural cosmetics demand. Product knowledge, transparency and social influence strengthen these drivers. Sustainable packaging and responsible sourcing are more and more important. However, price and consumer confusion about certifications remain barriers for buyers. For this reason, suppliers must provide clear technical documentation, traceability and the certifications required by cosmetic manufacturers.
Regulatory and certification frameworks of natural ingredients influencing the cosmetic market
In Europe, several regulatory and certification frameworks shape the natural cosmetics sector. These include COSMOS, NATRUE, ICEA, VEGANOK and EU ECOLABEL . Each certification has its own rules for natural or organic content, sustainable sourcing and processing methods. These certifications often require third-party audits and go beyond legal requirements.
Table 11: Main legal requirements influencing the cosmetic market
| Name framework | Description |
|---|---|
| COSMOS | International standard for natural and organic cosmetics. Ensures natural ingredients, restricted synthetic use, environmental sustainability and ethical production. Includes COSMOS Organic & COSMOS Natural. |
| NATRUE | Strict certification for natural and organic cosmetic products. Allows only natural/derived-natural ingredients and bans synthetic fragrances, mineral oils, GMOs, silicones, etc. |
| ICEA | Italian certification body for organic, eco-friendly and vegan cosmetics. Ensures natural origin ingredients, sustainability standards and ethical sourcing. |
| VEGANOK | Certification guaranteeing products are 100% vegan and cruelty-free, with no animal-derived ingredients or animal testing. |
| EU ECOLABEL | Official EU environmental label for products (including cosmetics) ensuring reduced environmental impact, restricted hazardous substances and sustainable packaging. |
Source: ProFound, 2025
Tips:
- Provide full INCI transparency and clearly explain botanical extraction methods. EU buyers closely examine processing steps.
- Include IFRA and allergen statements for fragrance-related botanicals, such as essential oils.
- Share microbiological and contaminant-testing protocols in advance. This is especially important for plant extracts and oils and helps prove product safety.
- Use consistent naming. Always provide the Latin name, the plant part used, the extraction method and important composition markers (chemical fingerprints). This helps buyers trust the production identification.
- Provide certificates and laboratory results in English and, where possible, in French, Italian, or German to support buyer review.
3. Which European markets offer the most opportunities for natural ingredients for cosmetics?
Based on ITC data from 2020 to 2024, the European market for natural cosmetic ingredients offers strong and diverse opportunities. This is mainly because Europe is the centre for high-end perfumery and advanced skincare production.
The data shows that demand is highest in major manufacturing countries that produce luxury cosmetics for global markets. These include France, Germany, Italy, Spain, Ireland and Poland.
France, global leader in luxury perfumery and high-end skincare
France is Europe’s leading beauty market and the global leader in luxury perfumery and high-end skincare. This creates strong demand for premium natural ingredients (essential oils, specialty botanical extracts, high-grade carrier oils and butters). Recent factory investments and export growth show strong domestic production and ongoing demand for ‘made in France’ raw materials.
Suppliers of traceable essential oils and extracts are particularly competitive in France. Demand is strongest in fine fragrance houses, niche perfumers and premium skincare brands. These buyers look for clear origin stories, certified natural claims and small, high-quality batches. Market reports also show growing interest in green chemistry and biotech ingredients. These are often combined with strong storytelling in marketing.
Suppliers should highlight product origin and provide clear analytical data, such as GC-MS and contaminant testing. Lining up with with COSMOS or NATRUE standards where possible is an advantage. Small-batch sample programmes for perfumers and R&D teams are also important. Besides this, clear information on sustainability and social-impact sourcing can help meet expectations of French buyers.
Influential skincare / cosmetics manufacturers based in France:
- L’Oréal
- Clarins (Clarins Group)
- CHANEL (Fragrance & Beauty)
- Pierre Fabre (dermocosmetics)
- NAOS (Bioderma / Institut Esthederm / Etat Pur)
Influential importers / distributors of cosmetic ingredients based in France:
- Lucas Meyer Cosmetics (IFF)
- Sensient Beauty
- Cozmat (cosmetic raw materials supplier, France)
- SOPHIM (natural cosmetic ingredients; olive-derived)
Germany, largest personal-care market by volume in Europe
Germany is the largest personal-care market by volume in Europe. It is also a major adopter of certified natural cosmetics and dermocosmetic actives. Consumer studies and market trackers show above-average penetration of COSMOS/NATRUE products. They also show strong growth in natural and organic lines, particularly in skincare and dermo cosmetics.
There is a high demand for scientifically characterised botanicals and standardised extracts. Clinically supported actives, such as anti-age, anti-inflammatory and skin barrier actives, are also in demand. German buyers focus more on proven results than on price alone. They prioritise documented efficacy, contaminant testing, REACH compliance and supply-chain transparency. This makes certified, lab-backed natural ingredients highly attractive.
Suppliers should provide full technical dossiers, including stability, safety and supply-chain traceability. They should translate important documents into German where possible. Suppliers should also seek distribution partnerships with specialised natural and dermocosmetic distributors. Certification (COSMOS/NATRUE) and third-party lab results strongly influence purchasing decisions.
Influential skincare / cosmetics manufacturers based in Germany:
- Beiersdorf (NIVEA, Eucerin, etc.)
- Henkel (Consumer Brands: hair, etc.)
- Weleda (natural cosmetics)
- BABOR
Influential importers / distributors of cosmetic ingredients based in Germany:
- Brenntag (Beauty & Personal Care distribution, Germany)
- Azelis Germany (incl. Personal Care)
- IMCD (Beauty & Personal Care; Germany lab presence)
- TER Chemicals (personal care ingredients)
Italy, strong domestic cosmetics industry with an export orientation
Italy combines a strong domestic cosmetics industry with a strong export focus. Recent national statistics show rising purchases of natural and sustainable cosmetics. They also show continued investment in manufacturing capacity. Italian brands and private-label companies value sensory quality, such as texture and aroma. They also prefer ingredients with strong Mediterranean or craft-based stories.
Mediterranean botanical extracts, such as olive derivatives and rosemary, perform well. Carrier oils and new active ingredients that improve texture and scent also do well. Italian formulators look for ingredients that create sensory difference in both mass-market and prestige products. They also need ingredients that can scale to export volumes. Trade fairs, such as Cosmopack and SANA, remain important sourcing channels. This information comes from the "Annual Report, 56th analysis of the cosmetics industry and consumption in Italy in (2025)".
Influential skincare / cosmetics manufacturers based in Italy:
- Intercos (contract manufacturing)
- Davines Group (haircare + skincare)
- KIKO Milano (makeup + skincare)
Influential importers / distributors of cosmetic ingredients based in Italy:
Spain, Europe’s fastest growing cosmetics exporters in recent years
Spain has been one of Europe’s fastest growing cosmetics exporters in recent years. Fragrance and beauty exports grew strongly with double-digit growth to record export values in 2024. Spain is also becoming an increasingly important market for essential oils, botanical extracts and export-oriented finished brands.
Spanish perfumery and skincare manufacturers buy Mediterranean and export-ready natural ingredients. These include citrus, olive, almond derivatives, as well as essential oils. Suppliers gain interest from Spanish SMEs and consolidators when they offer cost-competitive and traceable product lines. Strong origin stories and export support also help suppliers succeed.
Influential skincare / cosmetics manufacturers based in Spain:
Influential importers / distributors of cosmetic ingredients based in Spain:
- Brenntag Spain
- Azelis Spain
- Barentz Spain
- Chemir S.A. (Spain; raw materials production & distribution)
Ireland, centre of fragrance manufacturing and headquarters
In Ireland, corporate and trade data show a concentration of fragrance and odoriferous manufacturing and headquarters (HS-3302/3301 activities). This makes Ireland a strategic B2B procurement hub for raw mixtures and aroma bases. Strong commercial results and continued investment by large global fragrance companies confirm this ongoing activity.
A possible market entry strategy is to target B2B fragrance houses, flavour-and-fragrance multinationals and specialist aroma formulators based in Ireland. This also includes companies that use Ireland as an EU hub. Unique essential oils and reliable supply chains also important. Buyers expect strict safety and allergen documentation.
An influential fragrance / cosmetics manufacturer based in Ireland is is Fragrances of Ireland (Inis).
Influential importers / distributors of cosmetic ingredients based in Ireland:
- Brenntag Ireland
- IMCD UK & Ireland
- Univar Solutions Ireland
- Barentz Ireland
- Azelis (personal care ingredients; Ireland footprint)
Poland, growing EU manufacturing and export hub for cosmetics
Poland is becoming an important EU manufacturing and export hub for cosmetics. Many mid-market and private-label manufacturers operate there. National industry reports place Poland among the EU’s top cosmetics exporters. The country has strong capacity in toiletries, haircare and oral care, creating steady demand for scalable natural ingredients and private-label supply.
There is strong demand for mid-priced carrier oils, botanical extracts and functional naturals ingredients. Private-label and contract manufacturers especially seek these products. Many of them export widely across the EU. Competitive pricing, combined with strong QA and QC systems, and compliance with REACH/IFRA, can help suppliers stand out.
In conclusion, suppliers of natural ingredients should prioritise France for luxury perfumery, Germany for volume and diversification across all segments, and Ireland for strategic B2B industry partnerships. Italy, Spain and Poland also offer strong secondary markets. These countries suit suppliers who want to benefit from specific growth paths and changing manufacturing environments.
Finally, the EU’s consistent net-import position for raw materials (HS 3301) confirms that the demand for high-quality natural ingredients continues to grow.
Influential skincare / cosmetics manufacturers based in Poland:
Influential importers / distributors of cosmetic ingredients based in Poland:
- IMCD Poland
- Brenntag Poland
- Barentz Poland
- Natural Poland (import & distribution of cosmetic raw materials)
Tips
- For Poland: focus on logistics and reliable volumes. Offer flexible minimum order quantities (MOQs) for manufacturers that are scaling up for export. Provide clear compliance paperwork (REACH registrations or pre-registrations, IFRA when applicable). Working with a local distributor or agent makes market entry easier.
- For Ireland: B2B relationships and supply agreements might be the fastest route to sales. Consumer market stories are less important in this market.
- For Spain: work through Spanish distributors and exporters. Show that you are export-ready by providing proper documentation and proof of EU compliance. Highlight competitive pricing and traceability. Case studies of export success help in buyer conversations.
- For Italy: provide proof of batch consistency, sensory sheets and sample packs. Prepare sales materials in Italian and emphasise supply reliability to meet both domestic and export manufacturing runs. Participation in or representation at, Italian trade fairs helps buyers discover new suppliers more quickly.
- Also for Italy: ensure transparency by sharing clear provenance information and detailed testing data, including GC-MS and contaminant results. Align with COSMOS or NATRUE standards where applicable. Offer small-batch samples for perfumers and product developers, and clearly communicate sustainability and social-impact efforts to meet buyer expectations.
4. Which products from developing countries have the most potential in the European natural ingredients for cosmetics market?
European demand for natural, sustainable and ethically sourced beauty products continues to grow in 2025.
This trend is clearly visible at Cosmoprof Worldwide Bologna 2025. Exhibitors across all sectors showed progress in green chemistry, biotech ingredients, ethical sourcing and circular packaging solutions. Demand remains particularly strong for bioactive ingredients, botanical extracts, essential oils, vegetable oils and functional naturals used in skincare, haircare and wellness formulations.
Detailed data on ingredient demand from In-cosmetics Global 2025 will only be available after its November edition. However, insights from Cosmoprof already show a clear market direction. At Cosmopack and in dedicated innovation zones, including the Fragrances & Ingredients Zone, there is growing interest in raw materials with proven efficacy, traceability certifications, biodegradable profiles and biotechnological origins.
Overall, the 2025 focus at Cosmoprof highlights the increasing maturity and sophistication of the European natural-beauty supply chain.
Table 12: Cosmoprof 2025 cosmetic highlights
| Sector | Description |
|---|---|
| Cosmopack | The entire beauty supply chain: raw materials, ingredients, contract manufacturing, private label, packaging, machinery, formulation and filling technologies. |
| Cosmo Perfumery & Cosmetics | Retail-focused finished products: perfumery, skincare, personal care, makeup, toiletries, dermocosmetic brands and international beauty companies. |
| Cosmo Hair, Nail & Beauty Salon | Professional beauty & salon industry: haircare brands, barbershop, hairstyling equipment, salon furniture, nail care, spa & wellness products and services. |
| Special Zones – Fragrances & Ingredients Zone | Dedicated area for raw materials, ingredients and fragrance industry leaders. Focuses on essential oils, plant extracts, fragrance houses, perfume creators and manufacturers. Established to meet growing demand for sourcing fragrance & active ingredient solutions; complements existing raw material exhibitors in Cosmopack. |
Source: CosmoProf Bologna, 2025
Continued high demand for plant oils and butters
Cold-pressed carrier and vegetable oils such as jojoba, argan and almond are widely used by European formulators. They are mainly used as natural emollients and as effective carriers for active ingredients. In addition, plant butters including shea and cocoa remain popular in the market. This is due to their sensorial richness, their contribution to product stability, and their premium positioning in body-care and haircare products.
Across Europe, demand for these oils and butters is supported by the continued rise of natural and ‘clean’ cosmetics. In these products, plant-based emollients are seen as essential components of moisturising, haircare and sun-care formulations. Market forecasts show sustained growth in natural and organic beauty spending. This reinforces the importance of these ingredients in future product development.
To succeed in this segment, exporters must provide clear technical and regulatory documentation. This includes clear transparent provenance information and full botanical identification. Details should cover the INCI name, Latin name, plant part used and extraction method.
Suppliers must show evidence of quality and safety controls as well. These are things such as fatty-acid profiling, oxidation and stability analysis, microbiological results, and contaminant screening. Certifications, including organic status, COSMOS alignment are expected more often. Clear information on REACH obligations is also required, as well as allergen and IFRA-related disclosures when relevant.
From a commercial perspective, European buyers value suppliers that offer small but representative samples for laboratory and sensory testing. These samples should be supported by clear information on texture and aroma. Buyers also expect reliable supply conditions and scalable minimum order quantities. This allows suppliers to support both niche brand development and larger-scale production.
Botanical extracts and functional actives
In the European cosmetics industry, there is strong interest in standardised botanical extracts that offer clearly defined active compounds and repeatable performance.
Alongside traditional plant actives, demand is growing for biotech-derived ingredients and upcycled botanical extracts. This is especially true for materials sourced from agricultural by-products. These ingredients combine proven effectiveness with credible sustainability claims, which align well with EU market priorities.
There is also increasing use of multifunctional natural ingredients. These include botanical humectants and antioxidant complexes that can support preservation systems. They are widely used in dermocosmetic and premium skincare products. Brands use them to improve performance while maintaining natural product profiles.
European formulators are under pressure to show clinical relevance and proven performance. As a result, they prefer botanical actives that are supported by analytical markers and efficacy data.
Botanical actives are now a strategic growth lever for brands. They support clear consumer claims, such as moisturisation, brightening, anti-ageing and soothing. They also help justify premium pricing and clean-label positioning. In addition, they support sustainability and traceability narratives that influence purchase decisions.
Vegetable (fixed) oils are core base ingredients in formulations. They act as moisturises, emollients and delivery systems. When combined with high-value actives and certification claims, such as organic, cold-pressed, single-origin, they also serve as important product differentiators.
Table 13: Known and new ingredients with market potential.
| Ingredient (group) | Botanical source / example | Primary function / consumer claim | Market relevance (commercial angle) |
|---|---|---|---|
| Vegetable (fixed) oils — Coconut oil | Cocos nucifera (coconut) | Emollient, skin barrier support, moisturiser | Commodity base ingredient but premiumised as ‘virgin or cold-pressed’, high consumer recognition; essential for natural moisturisation claims. |
| Vegetable (fixed) oils — Almond oil | Prunus amygdalus | Emollient, skin conditioning, soothing | Widely used for ‘gentle’ and ‘suitable for sensitive skin’ positioning. |
| Vegetable (fixed) oils — Olive oil | Olea europaea | Emollient, antioxidant (tocopherols, squalene) | Premium/heritage ingredient used in moisturising and anti-age lines; supports Mediterranean/natural storytelling. |
| Vegetable (fixed) oils — Sesame oil | Sesamum indicum | Emollient, antioxidant (lignans), skin protectant | Valued for antioxidant profile; supports ‘longer shelf life’ and SPF-adjacent marketing. |
| Vegetable (fixed) oils — Castor oil | Ricinus communis | Emollient, antimicrobial/anti-inflammatory, hair conditioning | Used in haircare and acne-targeted treatments; niche but high-utility. |
| Jojoba / Wheat germ / Carrot seed oils | Simmondsia chinensis, wheat germ, Daucus carota | Barrier repair, vitamin E / SPF adjunct, photoprotective + repair | Often used as specialty oils to support premium claims (vitamin E, natural SPF, repair). |
| Essential oils — Lavender, Chamomile, Rosemary, Tea Tree | Lavandula, Matricaria, Rosmarinus, Melaleuca | Soothing, anti-inflammatory, antiseptic, deodorising | Strong in aromatherapy/functional positioning; regulatory/safety attention but high consumer appeal. |
| Skin-brightening actives — Licorice (glabridin), Arbutin, Kojic acid | Glycyrrhiza glabra, bearberry, fungal sources | Tyrosinase inhibition, reduces hyperpigmentation and even skin tone | Fast-growing claim area (tone/spot reduction). Natural alternatives to hydroquinone are commercially attractive. |
| Antioxidants — Vitamin C, Green tea (polyphenols), Beta-carotene, Resveratrol | Citrus / Camellia sinensis / carrots / grapes | Photoprotection, anti-ageing, collagen support | Core to anti-age positioning; supports premiumisation and ‘prevention’ messaging. |
| Protective / healing botanicals — Aloe, Calendula, Arnica, Witch Hazel | Aloe vera, Calendula officinalis, Arnica montana, Hamamelis virginiana | Soothing, wound repair, anti-inflammatory, astringent | High value in sensitive/dermocosmetic lines and post-procedural skincare. |
| Natural colourants & fragrances — Saffron, Beetroot, Rose, Neroli, Annatto | Crocus sativus, Beta vulgaris, Rosa spp., Citrus aurantium, Bixa orellana | Natural colouration and scent for clean-label cosmetics | Differentiation for natural/label-clean brands; perceived as ‘premium/natural’ sensory cues. |
Source: Information retrieved from Advances in the Astonishing World of Phytochemicals (2024).
Figure 19: Butters, vegetable and essential oils, extracts, and natural colourants stay main products of interest in EU cosmetics market (according to the previous study).
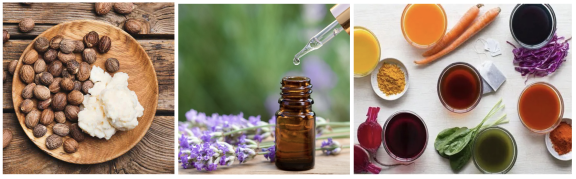
Source: African Oils, TrusTrade, Bansal Trading, 2025
Novel and niche bioactive ingredients
Novel and niche cosmetic actives increasingly include microbial and fermentation-derived ingredients, such as post-biotics and biosynthesised substitutes for rare botanical compounds. These ingredients are often developed alongside peptide mimetics produced through biotechnology. Where regulations allow, they are marketed with natural-origin positioning. Advanced marine-derived ingredients from algae and seaweed platforms are also gaining attention.
Another fast-growing category includes upcycled bioactives obtained from agricultural by-products. These include antioxidant-rich fractions and protein hydrolysates, which strongly support circular-economy and zero-waste consumer narratives.
A good example is coffee by‑products. Coffee grounds or pulp from processing in countries like Ethiopia, Colombia and Brazil are being valorised for cosmetic exfoliants and antioxidants. One example is startup Kaffe Bueno, a bioscience company that upcycles coffee by-products into high-performance, all natural cosmetic ingredients.
Biotechnology is also widely used to produce squalane, a high-valued moisturising and skin‑conditioning ingredient. Today, squalane is produced through the fermentation of sugarcane rather than from animal or less sustainable plant sources. Traditionally, squalane was made from shark liver oil. Fermentation-based production uses microbes to convert sugarcane into squalane. This process creates a high‑purity, vegan and sustainable alternative that meets increasing consumer demand for eco‑friendly and ethically produced actives.
Demand for these categories is rising, particularly in Europe. Brands are seeking high-performance natural ingredients that can visibly differentiate their products through both efficacy and sustainability. Biotechnological production offers controlled quality, consistent supply and lower environmental impact compared with wild harvesting of rare plants. This makes it attractive for premium, future-proof innovation strategies. Market interest is further supported by investments and partnerships between established cosmetics groups and biotech companies, which signal clear industrial adoption.
However, the use of novel actives requires strict regulatory assessment. Under the EU Cosmetic Regulation (1223/2009), suppliers must demonstrate ingredient safety with appropriate toxicological data. They must also provide recommended use levels and declare any GMO-related processing steps or special manufacturing conditions. Clear and complete documentation is essential to streamline product approval and ensure compliance.
From a commercial perspective, successful market positioning requires more than strong scientific evidence. In-vitro or ex-vivo efficacy data is important, but buyers must also show a clear plan for industrial scalability. Buyers increasingly expect traceability information and environmental impact statements, particularly from sustainability-driven brands. Pilot-scale supply agreements, stability data and formulation support can further speed up adoption in finished cosmetic products.
Tips:
- Prioritise traceability documentation (origin, harvest date, producer profile). Buyers use this in sourcing and marketing.
- Prepare a technical folder in advance. INCI, Latin name, extraction method, COA, allergen list, contaminant screens, stability summary, REACH/IFRA notes. Keep a two-page summary for quick buyer review.
- Where possible, invest in one third-party efficacy test (basic in-vitro or stability), it speeds adoption.
- Flag any sustainability credentials (organic, FairWild, Fairtrade, upcycling) and be ready to provide evidence.
Essential oils and botanical extracts show both high potential and strong current buyer interest. This demand exists alongside growing new biotechnological ingredients, as mentioned above.
Carrier oils and nut butters, like shea, baobab, cocoa, marula and argan continue to be particularly promising for premium skin- and haircare products. Shea and argan are already well established in European markets.
Standardised botanical extracts such as liquorice root, rosemary and turmeric fractions are used as actives. They support brightening, antioxidant and anti-inflammatory claims. Seaweed and algae extracts are also increasingly sought, especially where domestic European supply exists. These ingredients are used in skin-barrier and anti-ageing formulations.
Upcycled by-products, such as fruit pomace extracts and seed press cakes converted into antioxidants or emollients, are also attractive. This reflects growing interest in circularity and waste valorisation. According to CBI analysis, Which trends offer opportunities or pose threats on the European market for natural ingredients for cosmetics?, the most promising ingredient categories for exporters from developing countries include active ingredients, vegetable and essential oils, and botanical extracts. Successful market entry depends strongly on traceability, documentation and compliance.
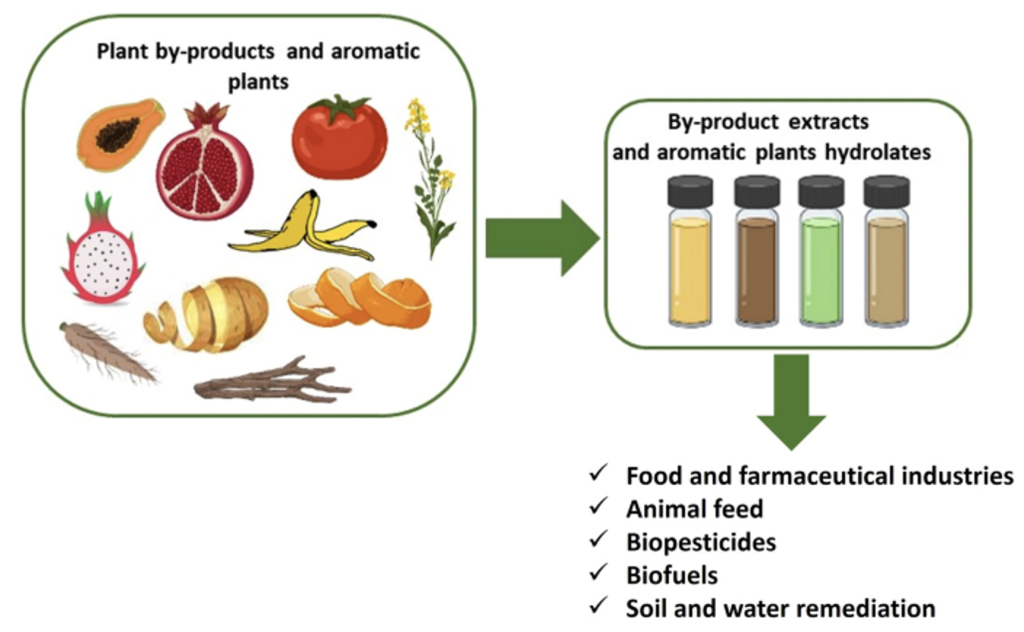
Additionally, studies highlight the growing link between cosmetic and agri-food industries. Food-derived ingredients can deliver skin benefits when used in cosmetic formulations. The transformation of agrifood waste into new cosmetic resources is increasing as illustrated in figure 6.
Figure 20. Various ways to use residual biomass (waste) from agrifood systems
The European Union remains a major importer of essential oils. EU-28 imports increased from €42 million in 2020 to more than €64 million in 2024. This growth shows strong internal demand and confirms the importance of essential oils in Europe’s high-value cosmetics and aromatherapy markets.
On the supply side, exports from developing markets increased from €41.9 million in 2020 to roughly €53.3 million in 2024. This shows the growing role of emerging economies as competitive suppliers. However, export growth is slower than overall global import growth. This suggests a widening global demand gap and creates opportunities for new producing countries to increase their market share. The data also points to continued diversification of sourcing, as developing countries strengthen their position in natural ingredient value chains.
Overall, these trade patterns confirm a growing and resilient market for essential oils and other botanical products. Demand is supported by interest in natural ingredients, clean beauty, aromatherapy and wellness. For producers in developing countries, the trend offers strong potential. At the same time, it brings higher competition and stronger requirements for quality, traceability and compliance with European regulations.
Tips
- Prioritise documentation by preparing a single technical dossier. This should include certificates of analysis, safety data sheets, contaminant tests, INCI names, Latin botanical names, extraction methods, microbiological results, and IFRA or allergen notes.
- Demonstrate quality and consistency by showing batch reliability, supported by clear quality-control data and traceability information.
- Ensure regulatory readiness by providing the REACH status, where applicable, documenting prior cosmetic use and organised safety dossiers.
- For fragrance suppliers, provide IFRA compliance and allergen declarations when available.
- Target the correct buyer type, such as perfumers, private-label manufacturers, or dermo-cosmetic brands, and support outreach with relevant case studies.
- Strengthen market positioning with sustainability evidence, including photos, producer profiles, life-cycle snippets, or basic carbon-footprint statements.
As demand for natural cosmetic ingredients continues to grow across Europe, long-term success will depend not only on product quality. Suppliers must also show strong traceability, regulatory readiness and consistent performance. Those who combine credible sustainability practices with robust technical documentation will be best positioned to build long-term partnerships within the European cosmetics value chain.
ProFound – Advisers in Development carried out this study on behalf of CBI.
Please review our market information disclaimer
Search
Enter search terms to find market research