
What is the demand for fish and seafood on the European market?
Europe is a market full of opportunity for seafood exporters. Using recently recorded statistics, this study shows that though COVID-19 has impacted the European seafood market and imports from developing countries fell slightly, overall demand for seafood has remained largely stable throughout 2020. With large appetites for seafood, Southern Europe presents the biggest opportunity for exporting your seafood products, and value-added shrimp and canned fish products have the greatest potential on European markets.
Contents of this page
1. What makes Europe an interesting market for this sector?
Despite the impacts of COVID-19 on both sourcing markets and European markets, Europe continues to be a major market for seafood from developing countries. Europe – the world’s number two seafood importer – imports for consumption, further processing and export, and hosts major trade hubs for distributing products in the region. While demand in the food service sector dropped, demand for retail remained strong.
European imports remain stable despite pandemic
The total value of seafood imports to Europe in 2020 was $54.8 billion. Seafood imports have been on the rise since 2015, peaking at $58.0 billion in 2018 (Figure 1). In 2019, imports dropped by 4%. Though this downward trend continued in 2020, the decline was smaller with imports falling only 1% in 2020.
In 2020 extra-European imports (which are total imports from outside of Europe) reached $19.8 billion, but fell more steeply than total imports did that year. After a similar peak at $22.3 billion in 2018, extra-European imports fell by 4% in 2019, but fell a further 7% in 2020.
Imports from developing countries reached $14.4 billion in 2020 (Figure 1). These also peaked in 2018 ($16.6 billion), falling by 6% in 2019 and falling a further 8% in 2020. Imports from developing countries made up 73% of total extra-European imports in 2020, only a slight drop from 2019 when this was 74%. This suggests that the relative significance of developing-county imports with respect to total imports in Europe has remained stable.
Intra-European trade actually increased slightly in 2020 (Figure 1). Whilst intra-European imports (products that are imported from other countries within Europe) also peaked in 2018 ($35.8 billion) and fell by 4% in 2019, they actually rose by 2% in 2020, to reach $35.0 billion.
This suggests that in the year that COVID-19 hit European markets, imports from developing countries decreased a little, but total imports within Europe actually marginally increased. A possible reason is that as many European countries experienced difficulties in logistics due to border closures or restrictions, they turned to their neighbouring countries or other suppliers within Europe to trade. For exporters from developing countries, increased intra-European trade is not necessarily a negative trend. This may also mean opportunities for your products to move within Europe through intra-trade between European countries. In the next section on major trade hubs, you can check which countries in Europe can help move your products across various European countries.
Tips:
- Get access to TradeMap and play around with trade data yourself. It will provide you with detailed insights into the trade flows of the products that you are interested in. Fish and seafood are covered under customs codes HS03 and HS16. Registration is free for people from developing countries.
- Check the OECD country list to understand which countries fall under the definition of developing countries, including which countries fall under the definition of least developed countries. This will help you better understand which countries are being discussed when using these terms.
Europe hosts major trade hubs for distributing your products across the region
The Netherlands, Germany and Belgium are Europe’s major seafood trade hubs. These three adjacent North-western European countries have coasts bordering the North Sea. Thanks to their strategic locations in Europe and port cities like Rotterdam, Hamburg and Antwerp, these countries act as a gateway to the rest of Europe. As intra-European trade is also strong in Europe, consider doing business with importers from this region if you want to establish a connection to the rest of Europe.
Dutch, German and Belgian seafood companies are skilled in doing business and trade. The legal, taxing and customs authorities are also well set up for handling imports and exports. This enables them to facilitate more routes to market for your products. Products are transported and moved through their seaports and warehouses and on to other destinations in Europe.
These countries’ imports are high, as are their re-exports. So, keep in mind that an increase in imports does not necessarily translate to an increase in consumption in these three countries. In 2020, total value of seafood imports from developing countries to the Netherlands was $1.5 billion, which represented 74% of their imports from outside Europe. Germany imported $1.4 billion from developing countries, 75% of their imports from outside Europe. Belgium imported $543 million from developing countries, which represented 78% of imports from outside Europe.
In 2020, Belgium and Germany’s imports from developing countries dropped by 1%, whilst the Netherlands imported 10% more from developing countries. These figures suggest that imports to these three trade hubs is likely to continue, despite the effects of COVID-19. This could be due to their long history of trade, and delivery to the retail sector (and before COVID-19 the food service sector) in other European countries.
Europe is the world’s number two seafood importer
Europe is the world’s second-largest seafood importer. In 2020, Europe imported $19.8 billion from outside Europe, a runner-up to the US, which imported $22.5 billion. Japan came in third, importing $12.8 billion. China imported $12.7 billion. In these top-four seafood markets, import values have been dropping since a peak in 2018, with the exception of China where imports peaked in 2019.
If we look specifically at seafood imports from developing countries, the composition of these four markets looks different (Figure 2):
In 2020, Europe imported the most, importing $14.4 billion from developing countries. The US imported $13.1 billion. Japan and China imported $7.2 billion and $6.2 billion, respectively. This illustrates that Europe is a key market for seafood from developing countries.
Demand for sustainable seafood also increases in Southern and Eastern Europe
Companies in Northern Europe and North America began making commitments to sustainable seafood in the early 2000s, and these commitments have expanded globally over time. There are many sustainability certifications out there, but the Marine Stewardship Council (MSC) and the Aquaculture Stewardship Council (ASC) have long been the main ones to which European retailers have committed for wild-caught and farmed seafood. However, this is gradually changing. The Global Sustainable Seafood Initiative (GSSI), a public-private partnership on seafood sustainability, developed a Global Benchmark Tool that recognises seafood certification schemes that successfully complete a rigorous and transparent benchmark process, underpinned by the FAO Code of Conduct for Responsible Fisheries. As a result, we are seeing a gradual shift in retailers from a commitment to selling seafood with specific eco-labels such as ASC and MSC, to a commitment to selling seafood which is certified by any GSSI-benchmarked standards, including standards such as Best Aquaculture Practices and GLOBALG.A.P..
For a long time, the demand for sustainable seafood was limited to North-western Europe and the Nordic countries. In recent years, however, sustainable seafood is also on the rise in Southern and Eastern Europe.
In the financial year 2019/2020, around 887,000 tonnes of MSC-certified seafood were sold on the European market, compared to about 787,000 tonnes in 2018/2019. In 2019/2020, 14,640 MSC-certified seafood products were available on the European market. North-western Europe still accounts for the largest share of the European sales of MSC-certified fish and seafood. In 2019/2020 there were 6,260 products available on the North-western European market, a 6% increase from the previous year (Figure 3). However, after Germany, now France has become Europe’s second-largest market for MSC products, both in terms of volumes and number of products on the market, taking over from the UK.
Disclaimer: Please note that these numbers are based on the sum of available MSC-certified products in the countries in these regions, and data from North-western Europe only covers Germany, the UK, the Netherlands and Belgium.
The growth of MSC-certified seafood sold was mainly accounted for by Southern Europe. In 2019/2020 Southern Europe had 2,890 MSC-certified products on the market, a 31% increase from the previous year. The number of MSC products available in France grew by 27% and the number of products available in Spain grew by 25%. Italy made the greatest strides with 49% more products on the market in 2019/2020 when compared to the previous year. Although still a small market, Eastern European also expanded their offer of products available with 673 products on the market in 2019/2020, 13% more than the previous year.
ASC was founded later than MSC but is growing fast. In January 2021, there were 1,336 ASC-certified farms, and another 238 in assessment. In December 2020, 9,748 ASC-certified products were available on the European market, a 32% increase from December 2019. In terms of geography, ASC is rapidly expanding the amount of products available in markets all over Europe. Looking at total ASC-certified products available in December 2020 per country, the total amount of products available in North-western Europe was 7,720, 27% more than in 2019 (Figure 4). In North-western Europe, the biggest selection of certified products are available in the Netherlands, with 2,719 certified products on Dutch shelves in December 2020.
Disclaimer: Please note that these numbers are based on the sum of available ASC-certified products in the countries in these regions.
The amount of ASC-certified products on offer in Southern Europe increased the most, growing 46% and reaching 2,577 products. The biggest Southern European market is France with 1,428 products available in December 2020. Meanwhile, the total amount of products available in Eastern Europe was 1,646, an increase of 32% when compared to 2019. This region’s biggest market for ASC products is Poland.
The main factor leading to the development of MSC and ASC is the commitment that international retail groups have made at the corporate level. While their commitments originated from consumer demands in North-western Europe, they currently often require their group companies in other markets to meet the same targets. As a result, we expect that the majority of fish and seafood sold in Southern European retail and institutional food service (for example schools and hospitals), just like in North-western Europe and the Nordic countries, will be sustainably certified in a number of years.
Tips:
- Check out the Seafood Certification and Rating Collaboration’s Sustainable Seafood Data Tool, which provides businesses with a snapshot of how much global seafood is rated and certified by its members, how much is in a public fishery improvement project, and how much is not yet on a path to sustainability.
- Read more about sustainability certification in the CBI study on what trends pose opportunities or threats to the European seafood market.
Organic products on the rise in Europe
Organic fishery and aquaculture products represent a niche market in Europe. If your business sources organic products, then this niche market presents an opportunity for selling your product in Europe. In the main EU countries surveyed by the European Market Observatory for Fisheries and Aquaculture (EUMOFA), Germany, Spain, France, Italy and the UK, 46,500 tonnes of unprocessed fishery and aquaculture products consumed in 2019 originated from organic production. This was a 3% increase from 2018, but represented 20% growth from 2015, indicating an increase of the share of organic products within European consumption of unprocessed fishery and aquaculture products consumption (Figure 5). In absolute terms, the UK and Germany lead EU consumption of organic fishery and aquaculture products.
Figure 5: 5-year trend of consumption of organic fishery and aquaculture products in top-5 countries, 2019 volume and % variation 2019/2018
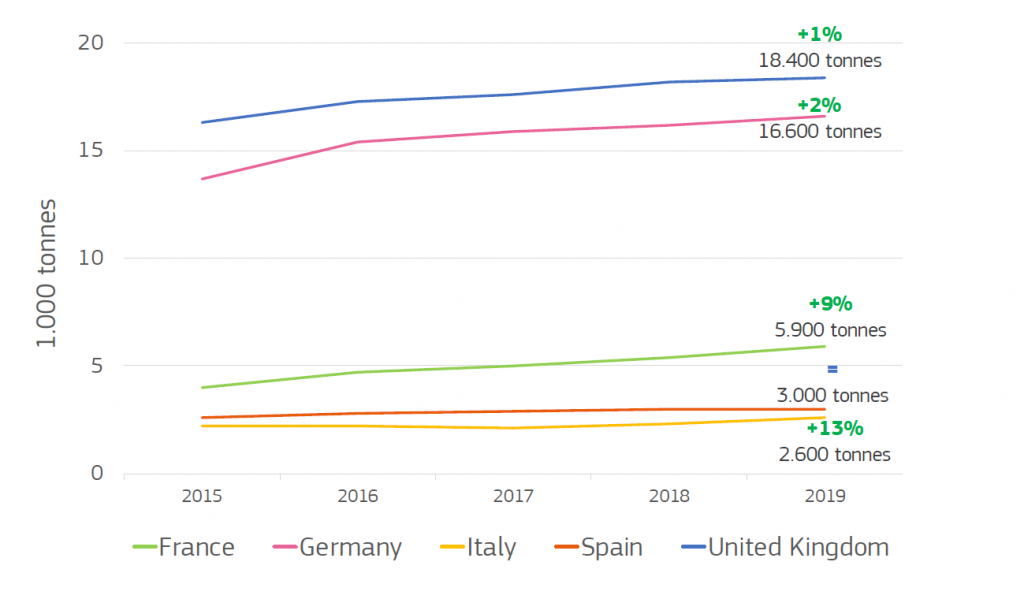
All countries surveyed reached their five-year peaks in 2019. Compared with 2015, the most significant increase was the 48% recorded by France. It was followed by increases of 21% in Germany, 18% in Italy, 15% in Spain and 13% in the UK. Information about 2020 has not been published yet at the time of research.
Though it is unclear what percentage of these products were imported from developing countries, these trends clearly indicate an increase in demand for organic seafood. The market for organic products is still small in Europe, but presents an opportunity for exporters to sell at premium prices to a small niche market.
Tip:
- Read EUMOFA’s The EU Fish Market 2020 to better understand the European fisheries and aquaculture industry from an economic perspective. This reports replies to questions such as: what is produced/exported/imported, when and where, what is consumed, by whom and what are the main trends?
More opportunities in retail sector as food service recovers
In the midst of ongoing disastrous global impacts from COVID-19, the European seafood market overall has remained relatively stable in 2020. However, COVID-19 did lead to significant shifts in European demand for seafood and in the supply of seafood due to measures in producing countries.
The food service industry was more affected by the COVID-19 pandemic than any other sector. Though out-of-home consumption of fishery and aquaculture products has a different relevance in different European countries (Figure 6), overall food service is an important marketing channel for seafood products. However, due to restaurant closures, the food service industry can no longer offer sit-down services, causing a sharp decline in business.
To illustrate this, let’s take a closer look at the demand for fresh tuna. This product is commonly sold to the North-western and Southern European food service industry. In North-western Europe fresh bigeye tuna is in demand in restaurants, especially in sushi bars or buffets. In 2020 North-western Europe’s imports of bigeye tuna from developing countries dropped by 88%. As restaurants slowly start to re-open with social distancing measures, you can expect this demand to start picking up again, but it is likely to take time before the food service sector fully recovers.
Figure 6: Sales of unprocessed fishery and aquaculture by channel in 2019 (% of total volume)
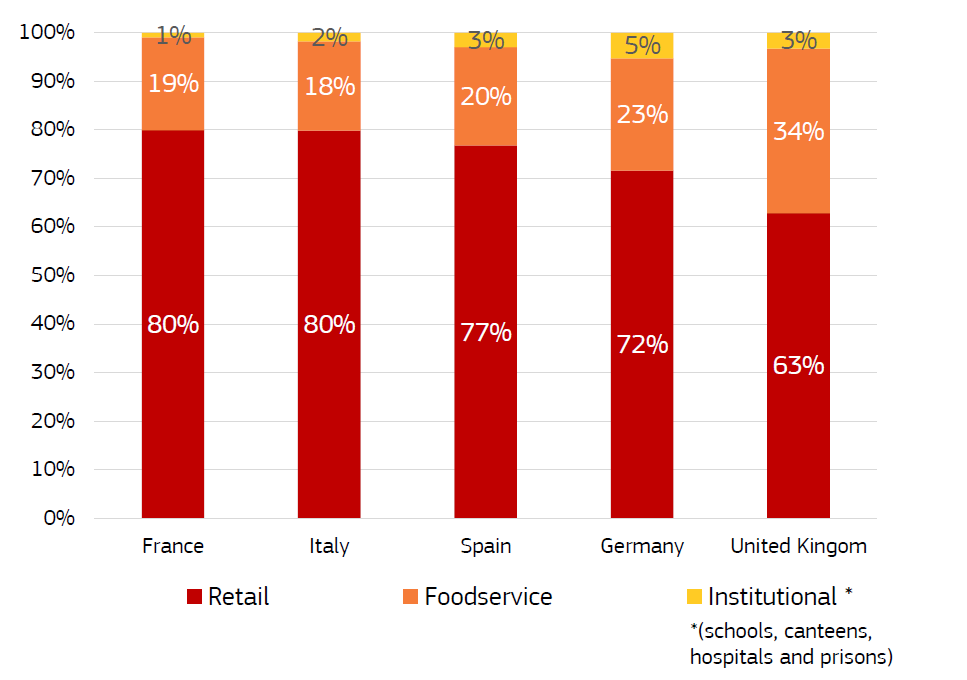
Source: EUMOFA (2020)
COVID-19 had a huge impact on importers and traders. This was worsened by logistical and supply challenges in sourcing countries. There were large inventory volumes and goods were moving slowly. The processing sector also faced significant challenges, such as the establishment of safe working conditions to avoid the spread of COVID-19 among workers. The areas of the processing sector that produced durable products and target the retail sector performed the best during the pandemic.
The retail sector was already the main sales channel for unprocessed fisheries and aquaculture product before the pandemic. Looking at data from France, Italy, Spain, Germany and the UK, between 63% and 80% of sales of unprocessed seafood was sold through retail in 2019. Retail became an even more important marketing channel during the pandemic. During the COVID-19 lockdowns, out-of-home seafood consumption was almost impossible and people were forced to cook at home. As a result, retail companies offer new ranges of seafood retail products targeted at home-bound consumers. Raw materials imported from developing-country exporters are often further reprocessed once they are in Europe, to prepare them for retail sales. Therefore as an exporter, it is worthwhile to connect with importers with ties to retailers or processors.
Looking ahead, the retail sector is likely to remain important. “More people are experimenting in home cooking. Thus, retail has been driving demand in the European seafood sector, especially for convenience products used in at-home cooking or take-away products and products sold in the supermarkets such as pizza, sushi or salad where seafood is incorporated,” an importer from Belgium said. At the same time, as restaurants re-open, demand for products sold in the food service industry will pick up again. The key is to remain flexible and stay in contact with buyers to anticipate changes.
Tips:
- Keep an eye out for EUMOFA’s The EU Fish Market 2021, due later this year, for updated figures on how COVID-19 affected sales of seafood in the retail and food service industry.
- Find more information about how COVID-19 has disrupted the seafood market in Europe in our CBI-news article.
- Learn about how to deal with COVID-19 in the Fish and Seafood Sector and how to continue business in these difficult times in this CBI study.
- Read more about consumption and marketing trends emerging from COVID-19 in the CBI trends study.
- Remain flexible and stay in contact with your buyers, to anticipate changing demand as restaurants re-open and perhaps cater to new markets for processed, value-added products.
UK remains an active seafood market
The United Kingdom left the European Union on 31 January 2020. After an 11-month transition period and delayed negotiations due to COVID-19, the EU-UK Trade and Cooperation Agreement came into force on 31 December 2020. The new agreement means there are changes to customs, tariffs, food safety checks and labelling. Practically, this means that it can become more complicated for products from developing-country exporters to pass through the UK to the rest of Europe, or to pass through the rest of Europe to the UK. To understand what changes apply to your business, take a look at the Seafish website. It provides easy-to-read and up-to-date information about how Brexit has changed rules around trading seafood with the UK.
With Brexit in place since the beginning of 2020, statistics show that direct imports into the UK from developing countries increased by 9% over the third quarter and 6% over the fourth quarter of 2020. The value of imports from Vietnam rose 29% in the last quarter of 2020, and import values over the whole of 2019 were 9% higher than in 2019. The same trend, but to a larger extent, applies for Ecuador. Value of imports in 2020 rose by a notable 104% when compared to 2019. At the same time, 2020 exports from the Netherlands to the UK declined by 10%, and exports from Germany to the UK dropped by 13%. If we look more closely at one species, we see that exports of warm water shrimp from the Netherlands to the UK declined by 22%. This suggests that perhaps less products are shipped to the UK via the Netherlands and Germany. However, it is important to note that the change in imports to the UK cannot be solely attributed to Brexit, as COVID-19 impacts have most likely also played a role.
Tips:
- Read the CBI news article on the effects of Brexit on seafood trade.
- Stay up to date on the deals around Brexit by reading the updates on the Seafish website, which offers a large amount of data, studies and overviews of the industry.
- Stay up to date on any new tariffs that are added. You can find these on the UK’s Global Tariff website.
- More than ever before, the United Kingdom is a market on its own. If and when possible, and taking into account the COVID-19 measures in your country of origin, visit British fishmongers, supermarkets and potential buyers in London or any other major city to get a better understanding of the market. Consider a virtual tour, if travel is hard or impossible.
2. Which European markets offer most opportunities for this sector?
The European seafood market should not be mistaken for a single market. Europe is made up of a diverse group of countries with separate but interrelated markets. The European seafood market is usually divided into three main regions: Southern, North-western and Eastern Europe. Success in Europe depends on an understanding of the needs of the different target markets, so this following section will zoom in on these three regions, highlighting country-specific opportunities.
Southern Europe is still Europe’s biggest seafood lover
Southern Europe represents the biggest opportunity for exporting your seafood products to Europe. Southern Europe’s imports from developing countries make up 58% of total European imports from developing countries, with Europe’s top three importing nations – Spain, Italy and France – located in Southern Europe (Figure 7). This block of countries do not only have the highest seafood consumption rate, but Spain, Italy and France are also Europe’s major processing nations.
Southern Europe consists of countries along the Mediterranean Sea. In this study, Southern Europe consists of seven importers: Spain, Italy, France, Portugal, Greece, Malta and Cyprus. The total value of Southern Europe’s seafood imports from developing countries in 2020 was $8.3 billion, a 12% drop from 2019 ($9.4 billion). Southern Europe’s imports from developing countries represent 82% of Southern Europe’s total ex-European imports ($10.1 billion), indicating that the majority of imported seafood to this region comes from developing countries.
The four product groups that dominate Southern Europe’s imports from developing countries are crustaceans like shrimp at $2.0 billion, molluscs (mainly squid and cuttlefish) at 1.9 billion, prepared or preserved fish such as tuna loins and canned tuna at 1.7 billion, and fresh fillets such as pangasius at $1.0 billion. The imported value of all product categories decreased between 8 and 10% in 2020, except for molluscs which decreased by 19%.
Southern Europe’s top suppliers from developing countries were Morocco ($1.10 billion), which mainly exports molluscs, and Ecuador ($1.06 billion), which mainly supplies tuna and shrimp. In 2020, Morocco surpassed Ecuador as Southern Europe’s biggest supplier, which can be explained by two factors. First, trade between Morocco and Spain is relatively easy due to their geographical proximity which created an advantage during a year when trade was challenging due to COVID-19 restrictions. Second, Ecuador’s tuna is under a lot of pressure regarding their prices. They face high competition from other countries, so a drop in export value is natural. Other large suppliers are China ($759 million), Argentina ($587 million) and India ($414 million).
In Southern Europe, Spain, Italy and France import the most from developing countries. Spain leads the pack, but also experienced the largest decline in imports in 2020. In 2020, Spain’s import values fell from $4.5 billion to $3.8 billion, a 14% decline. Italy’s imports fell from $2.2 billion to $2.1 billion, a drop of 8%, and France’s imports fell from $1.8 billion to $1.7 billion, which represented a 7% decline.
Spain as Europe’s leading seafood processor
Spain is Europe’s biggest lover of seafood. This country’s apparent consumption in 2018 was 46 kg/capita, illustrating Spain’s large appetite for seafood. In 2020, Spain’s imports from developing countries were dominated by molluscs ($1.1 billion), crustaceans ($911 million) and prepared and preserved fish ($747 million). Import values in all these product categories declined in 2020.
Spain also processes and re-exports part of their imports. Spain’s seafood processing industry focuses mainly on molluscs (squid and cuttlefish), crustaceans (mainly high quality head-on shell-on (HOSO) and headless shell-on (HLSO) shrimp), and canned fish (tuna, anchovies and sardines). Spain is Europe’s leading squid processing country, with major companies such as Congalsa and Fesba. Nueva Pescanova, another Spanish importer and processor, has a facility that is able to process 20,000 tonnes of squid annually. For more information, read the CBI study for entering the European market for squid and cuttlefish.
Italy: a major player in food service
Italy is also a major player, with a large appetite for anchovies and tuna. Apparent consumption in 2018 was 31 kg/capita. In 2020, Italy imports from developing countries were dominated by molluscs ($591 million), prepared and preserved fish ($587) and crustaceans ($359 million). The import value of prepared and preserved fish rose by 3% in 2020, whilst the other categories declined.
In Italy, generally a large part of seafood imports are destined for the food service industry, so the re-opening of restaurants is likely to have a significant effect on Italian imports from developing countries.
France imports dominated by crustaceans
France is another big fan of seafood, with 2018 apparent consumption at 33 kg/capita. France focuses on importing shrimp, molluscs and canned fish such as sardines and tuna. In 2020, crustaceans dominated imports from developing countries at $682 million and imports remained relatively stable in 2020. However, imports of prepared and preserved fish ($345 million), fish fillets ($339 million) and molluscs ($118 million) all dropped in 2020. Like countries in North-western Europe, France prioritises sustainable seafood and its market for organic shrimp has grown dramatically in the past five years.
Southern Europe hit hard by COVID-19
Southern European countries were hit hard by COVID-19. According to the European Commission’s European Economic Forecast Winter 2021, while some Member States are expected to see their GDP levels reach pre-crisis levels by the end of 2021, Spain and Italy in particular are forecasted to take longer. In the Southern European seafood sector, COVID-19’s negative impact is particularly apparent in their processing sector. This sector faced significant challenges, such as the establishment of safe working conditions to avoid the spread of COVID-19 among workers. Some businesses have had to close down.
Tips:
- To learn about economic forecasts of your buyer’s countries, take a look at the European Commission’s European Economic Forecast Winter 2021, which provides succinct analyses per country.
- Stay up to date with macroeconomic forecasts for the EU and its member countries which the European Commission updates four times a year.
- Take a look at EUMOFA’s The EU Fish Market 2020 to learn about the apparent consumption of total seafood in different European countries, and of specific species. This will give you an idea of how much of your products are actually consumed by individuals in Europe.
- Check out ShrimpTails magazine’s COVID-19 edition, which was released in April 2020, to see how Southern Europe’s shrimp trade was affected in the first phase of the global pandemic.
- If COVID-19 restrictions allow for it, consider visiting the Conxemar fish and seafood expo in Vigo, Spain, to network with buyers from throughout the region and world.
- Subscribe to the Conxemar bimonthly magazine. For a digital subscription of $35 a year, get a better understanding of the situation in the Spanish and broader Southern European fish and seafood industry.
- Bring an interpreter with you if you go to Southern Europe and you do not speak the local language.
- Check out the CBI product fact sheets for squid and cuttlefish, canned fish and Pacific white shrimp to find more detailed descriptions of major Southern European countries.
North-western Europe’s imports remained stable in crisis year
North-western Europe presents another interesting export opportunity, importing 35% of total European imports from developing countries. This region hosts four top importing countries: the United Kingdom, the Netherlands, Germany and Belgium (Figure 8).
In 2020, North-western Europe imported $5.0 billion worth of seafood from developing countries. Unlike Southern Europe, import values in 2020 actually increased by 2% from 2019 ($4.98 billion). Imports from developing countries represent 74% of North-western Europe’s total imports from outside Europe ($6.8 billion).
The three product groups that dominate imports from developing countries are fish fillets at $1.4 billion (mainly processed products from China such as pollock, pangasius and cod), crustaceans at $1.3 billion (mostly raw and peeled, used for re-processing and delivered to retailers) and preserved fish at $1.2 billion (canned skipjack and Atlantic bonito tuna). Whilst the import value of fish fillets fell by 12%, the value of crustaceans imports rose by 9% and imports of prepared and preserved fish increased by a notable 17%.
The main supplying markets from developing countries are China ($1.0 billion), which mainly exports fish fillets, and Vietnam ($821 million), which mainly exports pangasius and shrimp. Other large supplying markets are Ecuador ($490 million), which mainly exports shrimp and tuna, India ($361 million), which mainly exports shrimp, and Turkey ($315 million), which mainly exports seabass and seabream fish fillets. Chinese and Indian imports fell by 13% and 2% respectively, whilst import values from Vietnam and Turkey grew by 3% and 4% respectively. Import values from Ecuador increased by a notable 44%. Whilst Ecuador’s share in the Chinese market has decreased due to COVID-19, Ecuador’s presence in Europe grew stronger.
North-western Europe’s top-three importers are the UK, the Netherlands and Germany. In 2020 the UK imported $1.54 billion, a 1% drop from the previous year ($1.55 billion). Germany imported $1.41 billion, also 1% less than in the previous year ($1.43 billion). Imports to the Netherlands on the other hand grew to $1.50 billion, a 10% increase from 2019 (1.37 billion).
UK is North-western Europe’s largest market for seafood
The UK is North-western Europe’s largest market for seafood from developing countries and their apparent consumption of seafood was 22 kg/capita in 2018. The main products imported from developing countries are fish filets ($404 million), crustaceans ($390 million), prepared or preserved fish ($386 million) and prepared or preserved crustaceans and molluscs ($202 million). Whilst import values of fish filets and crustaceans fell slightly, import values of the latter two categories grew.
Due to Brexit, the UK market is one to keep an eye on. Though the effects of Brexit are difficult to quantify now, as negotiations have only recently been finalised, soon you will be able to start observing how Brexit’s trade agreements have impacted the imports of your products to the UK.
Netherlands and Germany as major trade hubs
The Netherlands’ appetite for seafood appears to be growing and apparent consumption in 2018 was 21 kg/capita. The main products imported from developing counties were crustaceans ($411 million), prepared or preserved fish ($385 million), fish fillets ($316 million) and value-added shrimp products ($244 million). Whilst import values of both fish fillets and value-added shrimp products fell by around 10% in 2020, import values for shrimp and prepared and preserved fish both grew by around 30%.
Remember that the Netherlands also re-processes a lot of shrimp, and is a trade hub re-exporting shrimp to other countries. Examples of Dutch re-processors of Pacific white shrimp are Heiploeg and Klaas Puul. These companies defrost the blocks, process them into the desired product and package them for distribution in retail or sale to other industry players. The 28% increase of imports of shrimp under HS030617 between 2019 and 2020 is likely to have been processed and have entered the expanding retail market.
Also an important trading nation, Germany’s apparent consumption of seafood in 2018 was 15 kg/capita. The main products they imported from developing countries in 2020 were fish fillets ($542 million), prepared or preserved fish ($402 million), crustaceans ($223 million) and value-added shrimp products ($122 million). Whilst import values of fish fillets dropped by 17%, values for prepared or preserved fish and crustaceans grew by 23% and 9%. Imports of value-added shrimp products remained stable.
Demand in North-western Europe shifted to retail
Though COVID-19 hit North-western Europe’s seafood industry, with its traders and processors, something notable happened in this region. Demand for seafood clearly shifted from food service to the retail industry. As a result, overall imports from developing countries have not decreased a lot. It will be interesting to see how the dynamics of demand from the food service sector and retail sector change as more countries ease their COVID-19 restrictions, especially in indoor or outdoor dining.
Tips:
- If COVID-19 restrictions permit, visit the annual Seafood Expo Global in Barcelona, Spain, to meet buyers from all over Europe and the world. Go to the bi-annual Fish International in Bremen, Germany, to meet German importers, wholesalers, retailers, and suppliers to the German market from across Europe. In the Netherlands, visit the PLMA International in Amsterdam, the biggest retail-focused Private Label show in North-western Europe, to meet with retailers and their suppliers.
- Combine visiting these events with visits to stores and companies in the area to learn more about how your products and those of your competitors are packaged, marketed and sold.
- To find information about North-western European importers, visit importers association websites. Examples are the Dutch Fish Importers Association and the German Seafood Verband.
- Take a look at ShrimpTails magazine’s COVID-19 edition, released in April 2020, to see how North-western Europe’s shrimp trade has been affected in the first phase of COVID-19.
Eastern Europe’s imports from outside Europe dropped
Though Eastern Europe imports a mere 3% of total European imports from developing countries, seafood imports to Eastern Europe steadily increased since 2015 and this region does present some opportunities for seafood exporters from developing countries (Figure 9).
Eastern Europe consists of a group of 11 countries: Bulgaria, Croatia, Czech Republic, Estonia, Hungary, Latvia, Lithuania, Poland, Romania, Slovakia and Slovenia. In 2020, Eastern Europe imported seafood worth $435 million from developing countries. This was a drop of 24% from 2019 ($572 million), by far the biggest drop in imports when compared to Southern and North-western Europe. Imports from developing countries represent 53% of total imports from outside of Europe ($819 million). This is a smaller portion than for Southern and North-western Europe, meaning that Eastern Europe imports a larger part of their seafood from non-developing countries.
The popular product groups imported from developing countries demonstrate that Eastern Europe is not a big spender when it comes to seafood and reflect Eastern Europe’s preference for low-cost seafood species like hake. In terms of products imported from developing countries, fish fillets dominated at $219 million (mainly Alaskan pollock and hake). This is followed by prepared and preserved fish at $81 million (mainly tuna) and crustaceans at $34 million (mainly shrimp). In 2020, import values for all three categories fell between 26% and 35%.
The main suppliers from developing countries are China ($140 million), which mainly supplies Alaskan pollock and salmon fillets, and Vietnam ($66 million), which mainly supplies shrimp and pangasius. Other key suppliers are Ecuador ($27 million), which mainly supplies tuna, Turkey ($25 million), mainly supplying seabass and seabream, and Argentina ($24 million), which mainly supplies hake. It is interesting to note that Poland is building processing capacity for seabass and seabream, which explains Eastern Europe’s share of imports from Turkey.
Eastern Europe’s top three importers of seafood from developing countries are Poland, Romania and Czech Republic. In 2020, Poland imported $210 million, a large drop of 25% compared to 2019 ($281 million). Romania’s imports actually increased in 2020. They imported $50 million, 6% above 2019 levels ($47 million). Czech Republic, Eastern Europe’s number two importer in 2019, imported $36 million in 2020, a dramatic 57% decrease from 2019 levels ($82 million).
Poland is Eastern Europe’s top importer and also a big processor, with an apparent consumption of 13 kg/capita in 2018. Poland saw a 44% drop in nights spent in tourism accommodations which is reflected in their import figures. In 2020 their dominant products imported from developing countries were imported fresh fillets ($150 million), crustaceans ($21 million) and prepared and preserved fish ($21 million). Imports of all these product categories fell between 22% and 34%.
Eastern Europe’s trade hub hit hard by pandemic
Though Croatia’s imports from developing countries in 2020 were a mere $23 million, this is an interesting country to mention for two reasons. First, Croatia’s tourism industry has been hit hard by COVID-19 and imported seafood in Croatia is mainly consumed in restaurants and in tourism. To illustrate this, imports of fish fillets, their largest imported product group, reached $6.8 million in 2020, a 27% decrease from 2019.
Second, Croatia could be seen as a trade hub for Eastern Europe. It is conveniently located along the Adriatic Sea, while lots of neighbouring countries do not have that access to the sea. This means that Croatia is an important supplier of fish and seafood to eastern countries like Bosnia, Serbia, Hungary, Slovakia and even Romania. You can consider Croatia as a logistical hub, opening up a world of possibilities in those countries.
Eastern Europe’s focus on tourism increased the region’s vulnerability to COVID-19
Eastern European countries such as Czech Republic, Slovakia or Hungary were some of the first ones to enforce strict lockdown measures to contain the spread. This region has a tendency to consume seafood in the food service industry, rather than in the home. Furthermore, seafood really caters to the tourism industry, rather than domestic consumers. Thus, it is not surprising that seafood imports overall have declined. With coastal tourism in Poland seeing activity in the third quarter of 2020 close to expected levels, there is hope that this might be the start of the slow comeback of tourism in these regions. The current progress of vaccinations is projected to further boost tourism in the summer of 2021, which is likely to have a positive effect on seafood imports.
3. Which products from developing (CBI project) countries have most potential on the European market?
Over the years, demand for convenience products in Europe has seen a strong growth, particularly for products that are quick and easy to prepare. During the pandemic, this demand has become even stronger as more people turn to home cooking and home deliveries amid the closure of the food service sector. This retail demand, as we mentioned in the previous sections, is likely here to stay. Therefore, as an exporter, providing direct products for this market (such as canned products) can provide you with a good opportunity to supply to the retail market. If processing your products within your own company or country is not possible, you can also supply raw material for the European processing industry. Next to supplying in these product groups, there are also some opportunities in supplying fresh products to niche markets.
Please note that we base our results in this chapter on product data from the developing countries where CBI is active. We calculate export values and volumes to the European market for these products. We define the European market as EU27+UK+European Free Trade Association. The table below shows products on HS 4 level which have seen the highest compound annual growth rate between 2016 and 2019*. The table also displays the developments based on CBI project countries. Below we look at which specific products are included for this. For more information on other high-potential products from CBI countries, read the annex to this study. The annex shows more specifics for the products based on their HS 6 codes, providing more in-depth analysis of which products and preservation (fresh, frozen etc.) provide a growing opportunity.
*2020 was not included due to the impact of COVID-19
Table 1: Imported value into Europe of different seafood product groups under HS4 and its compound annual growth rate (CAGR) between 2016–2019 for all developing countries and CBI project countries.
|
Developing countries |
CBI project countries |
||||
|
Imported value (USD '000) |
Growth rate (2016–2019) |
Imported value (USD '000) |
Growth rate (2016–2019) |
||
|
1604 |
Prepared or preserved fish; caviar and caviar substitutes prepared from fish eggs |
3,224,535 |
6% |
842,201 |
0% |
|
0307 |
Molluscs, fit for human consumption, even smoked, whether in shell or not, live, fresh, chilled, . . . |
2,091,713 |
3% |
820,440 |
3% |
|
0306 |
Crustaceans, whether in shell or not, live, fresh, chilled, frozen, dried, salted or in brine, . . . |
3,544,111 |
0% |
734,187 |
-2% |
|
1605 |
Crustaceans, molluscs and other aquatic invertebrates, prepared or preserved (excluding smoked) |
976,509 |
2% |
304,672 |
5% |
|
0303 |
Frozen fish (excluding fish fillets and other fish meat of heading 0304) |
907,561 |
2% |
277,251 |
1% |
|
0304 |
Fish fillets and other fish meat, whether or not minced, fresh, chilled or frozen |
2,851,497 |
4% |
221,363 |
9% |
Value-added shrimp products
All European countries import shrimp products and depending on the origin and the market there are many varieties such as head-on shell-on (HOSO), headless shell-on (HLSO), easy peel, peeled, breaded. Most shrimp are imported under the category of crustaceans (HS0306), and a smaller amount is imported under the category of prepared and preserved crustaceans (HS1605). The shrimp imported as prepared and preserved has undergone at least two processing steps. For example, the product is cooked and peeled. These products are often referred to as “value-added” products and are under HS160521 and 29.
In 2020, prepared and preserved shrimp represented about 18% of Europe’s total warm water shrimp imports, with a total value of $750 million from developing countries. This group of products has seen an annual growth rate of 2% per year for imports from developing countries. The annual growth rate over 2016–2019 from CBI active countries reached 5%. Therefore, adding value to your shrimp products can offer you a good position on the European shrimp market as the demand for this product is growing.
The major share of imports for these products from developing countries under HS160521/29 goes to the Netherlands, followed by the United Kingdom and Germany. Together they are responsible for importing 68% of the imported volume. The Netherlands imported $219 million worth of these products and a total volume of 119,000 tonnes. However, we have to take into account that the major share is exported from Morocco and actually consists of peeled and processed brown shrimp (a type of cold water shrimp). Imports from Morocco are followed by Vietnam and Indonesia which do supply warm water shrimp.
The United Kingdom is the second-largest importer of prepared and preserved warm water shrimp with a combined value of $180 million, and just over 16,000 tonnes. Its main supplier is Vietnam. Germany comes in third, taking a share of 14% with a combined value of $107 million and a volume of 11,000 tonnes.
While the Southern European market mostly imports and consumes HOSO products, the rest of Europe has shifted towards a strong demand for convenience products. These products are ready to-eat or easy to prepare (peeled and cooked shrimp sometimes accompanied with sauce, or breaded shrimp ready for deep-frying) at home or in restaurants.
Tips:
- Read the CBI study on Pacific white shrimp to understand the market potential and market entry requirements for Pacific white shrimp.
- Sign up for ShrimpTails Inbox Intelligence for free to get access to the latest stories on the shrimp industry, with topics ranging from production, trade and trends.
Canned fish products
The COVID-19 pandemic has caused a positive trend in the European consumption of canned fish as more people turn to home cooking and retail purchases. As retail became the main outlet for fish and seafood, the demand for canned fish increased, especially during the period of lockdown. This reinforced the trend that European consumers want simple, ready-to-eat and convenient seafood.
Prepared and preserved fish products to the EU (HS1604) have been growing with a yearly rate of 6.1% between 2016 to 2019 and the total product reached an import value of $3.2 billion in 2020. Within this group prepared and preserved tuna has seen a growth of 7.5%. However, the import value from CBI countries has diminished over these years with 2% per year. Despite the slight drop, the growing demand for and consumption of these products should provide opportunities for you as an exporter to enter this market.
In 2020 Europe imported a total of 702,395 tonnes of canned fish. Of the total volume imported 375,850 tonnes (53%) came from non-European countries. As an exporter, this means that the canned fish segment relies on third-country producers to meet demand and presents a very clear opportunity to enter the market.
Canned tuna
Canned tuna saw the largest demand among the canned fish segment in Europe in 2020, with a total import value of $2.5 billion. With the onset of the COVID-19 pandemic, this affinity towards tuna has increased. It is a familiar fish that is easy to prepare and known to many Europeans. This presents plenty of opportunities for non-European canned tuna exporters to enter the European market.
Spain is the leading importer for canned tuna with a market share of 23% in 2020, reaching an import value of $574 million and a volume of 130,000 tonnes. The leading supplier to Spain is Ecuador. Spain is followed by another Southern European country, Italy, taking a share of 18% with $453 million and 72,000 tonnes. In Italy, Ecuador also has a strong position as main supplier. Third is Germany with imports of $335 million and a volume of 81,000 tonnes. Germany’s main suppliers are the Philippines and Papua New Guinea.
If you are interested in doing business with Spanish buyers in the canned fish industry, bear in mind that Spain is a major processing country and also has established exports within Europe. Therefore by engaging with the Spanish market, your product can also access the rest of Europe. Several Spanish companies even focus their marketing efforts on international markets, making just 30% to 40% of their sales domestically.
Germany is neither a tuna fishing nor processing nation. However, the country is an important market for canned tuna, especially for non-European suppliers. Germany has a few local processing companies producing value-added products, therefore relying heavily on foreign suppliers to meet demand. Most of the canned tuna products sold to Germany are under private labels, meaning these importers will work with their source companies to produce a product under the company’s specifications and sold under the company’s brand name.
Tips:
- Read the canned fish study to get more detailed information on the canned fish market and its opportunities.
- Monitor the latest products of John West and Princes to check what kind of innovative products these companies are developing to increase consumer interest in canned fish and to understand potential changes in consumption patterns. Stay ahead of your competitors and prepare to meet your European customers’ demand in case they ask you for these specifications.
- To get acquainted with the major fish canning companies in Spain, visit Galicia, where almost 60 fish canning companies are based. Contact ANFACO-CECOPESCA, a Spanish tuna processing organisation which represents the majority of these canners.
- Attend the European Tuna Conference to stay up to date on the latest trends in the European tuna market.
Canned sardines and anchovies
Canned sardines and anchovies have also experienced growth over the last years, with a growth rate of just under 3% per year. The CBI countries have seen a growth of 1%, which provides an opportunity for exporters to gain market share. Europe’s average annual sardine consumption grew from 0.53 to 0.57 kg per capita between 2015 and 2019.
The combined imports of sardines and anchovies reached $380 million, representing 12% of all canned fish products. While anchovies are imported by the same countries as canned tuna, canned sardines display a different pattern. Here France is the leading importer with a share of 23%; $45 million with a volume of 12,000 tonnes. France is followed by the United Kingdom with an import share of 17% and $34 million in value, with a volume of 10,500 tonnes.
Anchovies are considered a delicacy in Italy. This scenario provides an opportunity for you to enter the growing Italian market for canned anchovies.
Frozen fish products for re-processing
The value of frozen fish products under HS0303 imported from developing countries has increased by 2% a year. These products include a wide range of tuna, sardines, anchovies and other species. The total import value from developing countries is around $900 million.
When we focus on the CBI countries, we see a growth of 3% for frozen anchovies and a growth of 8% per year for frozen sardines. As explained before, these products are used for canned products but are canned in Europe. Large canneries and processing companies are based in Spain and France. Exporting your product to these countries can provide you with an opportunity if you are not able to directly produce canned products.
Therefore approaching processors from Spain, Italy, France and Portugal can be beneficial, especially since their products ultimately end up in the retail and food service markets. Spain has the most processing plants (over 60), followed by Italy (over 10 plants, mostly for bluefin tuna), France (5-8 plants), and Portugal (5-7 plants). Making a deal with the right cannery can help you get your products on European retail market shelves.
Remember that these canneries often own their own fishing fleets that supply them with the raw material for processing. However, limitations on their operational catch volume or international quotas can limit their raw material supply. When their fishing fleet supplies less than the capacity of their facility, potential suppliers like you can step in. In addition, there is the possibility to supply raw materials for the processing industry under the ATQ (autonomous tariff quotas). Under the ATQ system, certain fishery products are exempted from tariffs up to a certain volume. Each year, the ATQ gets refreshed, meaning that until that year’s volumes have been used, all trade between the European Union and developing countries that do not have an trade agreement is tariff free.
Fresh squid and cuttlefish
While frozen squid and cuttlefish (and partly frozen octopus), which fall under HS0307 and are molluscs, dominate the imports for these species, the total value of frozen squid and cuttlefish has been declining by 3.5% per year between 2016–2019. However, the volume increased by 1% in the same period, showing a growing demand for this product. Please note that this does mean that pricing has declined considerably for this product, most likely related to an oversupply.
Contrary to the frozen product, fresh squid and cuttlefish has seen a stable import pattern. However, the value from CBI countries has increased by 26% per year over the last years, largely due to the trade between Morocco and the Southern European countries Spain and France. Importing nations in North-western Europe have also seen a steep increase in the imports of fresh products. This is most likely because countries such as the Netherlands, Germany or Belgium serve as trade hubs, distributing the product across Europe.
The reason for the increase of imports could be lower production in the European region. With decreasing catches, importing fresh squid and cuttlefish from other countries outside Europe could become increasingly interesting for European importers. The market development for squid and cuttlefish is expected to remain relatively stable in the coming years. Increasing prices for octopus, one of the main competitors, can offer the opportunity for squid and cuttlefish to replace this product in the market. Thus, this could also possibly increase the demand for squid and cuttlefish in the European market.
Looking further into the future, squid and cuttlefish will need to obtain sustainability certification to maintain their access to the European market. While this might not be an issue for you as an exporter at the moment, you need to consider this long-term trend and your ability to keep market access.
Tip:
- Read the squid and cuttlefish study to get more detailed information on the fresh squid and cuttlefish market and its opportunities.
Swordfish for the niche market
Based on the EUMOFA study, tuna is the most-consumed marine species in Europe. The same study also shows that the 3.14 kg per capita consumption of the commodity group ‘tuna and tuna-like species’ in 2016 included 97% tuna and 3% swordfish.
The import value of swordfish in Europe in 2020 reached almost $27 million, with a growth of 17% a year over the period of 2016–2019 for all swordfish products from developing countries. The major share is taken by fresh fillets with 70%. Looking at the CBI countries, the demand for these fresh products have shown a 54% growth rate per year over 2016–2019 and were responsible for 92% of the import value of the developing countries in 2020. The major supplier to Europe was Sri Lanka, with a 92% market share for fresh swordfish fillets.
Spain leads in the import of fresh and chilled swordfish with 4,124 tonnes, accounting for 44% of total imports sourced from non-European countries. Volumes increased by 36% from 2015 to 2018.
Italy came in second in Europe in 2018, following Spain. Most imports, however, are sourced from within Europe, as only 2% of imports come from non-European countries. For exporters looking to enter this market, that is not necessarily a negative thing. Trade data shows that imports from non-EU suppliers have more than tripled in volume since 2015, growing by 334%.
The importance of one segment over another can vary significantly from one part of Europe to the other. While street markets and specialised fish shops have quite a strong position in the Southern European market, a much larger part of fresh swordfish purchases goes to the food service industry in North-western Europe. Swordfish is less in demand in supermarkets in North-western Europe, where sustainability is very important.
Specialised fish markets, despite being accessible to the general public and selling mainstream products, also cater to the restaurant industry and ethnic groups. They often have a wider range of seafood options, sourced from direct European landings or from imported fish. By engaging with companies that have a presence on the specialised fish market, your niche products can find a way onto your desired markets. Most of the imported fish is imported frozen and defrosted in Europe. Swordfish is also the most popular of the bycatch species at fish markets, although all types of tuna bycatch products are available.
Tips:
- To learn more about how to enter the market for your niche products in Europe, check out the CBI market study on ethnic retail channels here.
- Check the Conxemar website to find swordfish importers/wholesalers in Spain.
This study has been carried out on behalf of CBI by Seafood TIP.
Please review our market information disclaimer.
Follow us for the latest updates
Search
Enter search terms to find market research